

A good developer team workflow is a short list of agreed stages, a named owner for each one, and automated checks that catch problems before users do. The stages are usually planning, design, coding, testing, deployment and maintenance. The workflow earns its keep when something breaks at 2 a.m. and everyone already knows who looks at what first.
This guide walks through each stage, shows how teams coordinate handoffs, and explains where uptime monitoring, SSL checks, network diagnostics and data validation fit. It ends with an incident workflow you can adapt and a few questions teams ask when they start formalizing how they work.
TL;DR
- Most teams work through the same seven stages: planning, analysis, design, implementation, testing, deployment and maintenance. The names vary, the handoffs matter more than the labels.
- Coordination comes from a shared backlog, testable acceptance criteria, a definition of done, standard branching and peer review.
- Automate whatever is repetitive: builds, tests, security scans and the checks that watch production after release.
- An incident workflow needs roles, a detection signal, a triage path and a blameless review. Write it down before the first outage.
- Give every stage one owner and review the process after each release cycle and each incident.
Table of Contents
- What a developer team workflow actually covers
- Coordinating work from planning to deployment
- Collaboration tools, by type
- Building automated checks into the workflow
- An incident management workflow that holds up under pressure
- Perspective: monitor the basics first
- Put these checks to work
- Assigning ownership and improving over time
- FAQ
- Sources
What a developer team workflow actually covers
A workflow is the series of tasks, processes and tools a team uses to plan, build, test and ship software. The formal version of this is the software development lifecycle. IBM describes the SDLC as a structured, iterative methodology that splits development into repeatable, interdependent phases: planning, analysis, design, coding, testing, deployment and maintenance.
Not everyone counts the stages the same way. TechTarget's overview of the SDLC notes that terminology and stage counts vary, but it identifies seven commonly recognized stages: planning, analysis, design, implementation, testing, deployment and maintenance. GitHub's SDLC guide groups them slightly differently, with requirements gathering and analysis, system design, coding, testing, deployment, and maintenance and support. It frames the lifecycle as a way to manage a project from start to finish with consistency, efficiency and quality.
What each stage means in practice:
- Planning. The team decides what the application should do, based on business requirements. Scope, goals and constraints get written down.
- Analysis. Those goals become technical ideas that engineers can act on.
- Design. Architecture, application behavior and the user interface take shape.
- Coding. Engineers build the software, usually with version control so features can be integrated safely.
- Testing. The team checks code quality and removes bugs before release.
- Deployment. The release reaches production and real users.
- Maintenance. The team keeps the system healthy, fixes defects and responds to incidents.
That last stage is where many team workflows are thinnest. Teams document how to plan and code, then improvise once production is live. A complete workflow treats monitoring and incident response as part of the lifecycle, not an afterthought.
Coordinating work from planning to deployment
The hardest part of any workflow is the handoff: product to engineering, engineering to QA, QA to operations. Microsoft's operational excellence guidance gives a practical list for formalizing this:
- Involve developers, testers, operations and product stakeholders early.
- Agree on scope and dependencies.
- Record manageable tasks in a backlog.
- Define testable acceptance criteria and a shared definition of done.
- Standardize branching and peer reviews.
- Automate builds and applicable tests, quality gates, security scans and artifact versioning.
- Standardize integration to prepare code for deployment.
- Hold blameless retrospectives and monitor pipeline metrics.
A few of these deserve a closer look.
A definition of done that people can check
"Done" should be something a teammate can verify in two minutes. A useful definition for a web service might include: code reviewed, tests passing in the pipeline, security scan clean, documentation updated, and a monitoring check in place for any new endpoint. If a ticket cannot be closed without that last item, monitoring stops being optional.
Branching and review rules
Pick one branching model and write it in the repository's contributing file. The specific model matters less than the consistency. Pair it with a review rule such as one approval from someone who did not write the change. Small pull requests get reviewed faster and break less, so many teams cap the size they will review in one sitting.
Plan deployment with operations
The Project Management Institute's Disciplined Agile guidance recommends planning deployment with operations engineers and release managers, automating operational functionality and the CI/CD pipeline, and building validation and verification into the lifecycle so defects surface early. Its underlying view is that quality comes from continuous collaboration and early testing, not from one inspection at the end.
That is a good test of your own process: if the first time operations hears about a release is the day it ships, the workflow has a gap.
Collaboration tools, by type
You do not need a long tool list. You need one tool for each job, and you need the team to agree on which one is the source of truth.
| Job | Type of tool | What to standardize |
|---|---|---|
| Tracking work | Issue tracker or backlog board | One backlog, one status vocabulary |
| Writing things down | Wiki or docs repository | Runbooks, decision records, onboarding |
| Talking in real time | Team chat | Separate channels for incidents and general chat |
| Code and review | Git hosting with pull requests | Branch rules, review rules, required checks |
| Build and release | CI/CD pipeline | Automated tests and gates before deploy |
| Watching production | Uptime, certificate and log monitoring | Who gets alerted, and how |
| Moving files | Secure file transfer | Expiring links, access control |
A mix of communication, documentation and incident tooling has long been the standard pattern in DevOps teams. The point is not the brand. It is that every handoff has a home, so nobody asks "where did we put that?" during an outage.
File handoffs are a small but common friction. Test data exports, design assets, build artifacts, and customer deliverables get emailed around or dropped into chat. A dedicated secure file transfer tool with shareable links keeps those handoffs in one place and out of inboxes.
Building automated checks into the workflow
Automation is where a workflow stops depending on people remembering things. CI/CD pipelines automate the develop, build, test, release and deliver phases to produce deployable artifacts with minimal human intervention, as AWS's DevOps guidance describes it. Teams preparing for roles that touch this work can find a helpful set of common CI/CD questions that show how automation across validation and release is usually discussed.
HashiCorp's well-architected guidance makes the same point for infrastructure. Infrastructure-as-code changes can be version-controlled and automatically tested, security-scanned and validated before deployment, so policy checks run before a change reaches production.
Pipelines cover what happens before release. Four checks cover what happens after, and they are cheap to add.
Uptime monitoring
The simplest production signal is whether the site answers. An uptime check requests a URL on a schedule and alerts someone when the response fails or is slow. Decide three things up front: which URLs matter (home page, login, API health endpoint), how many failed checks trigger an alert so a single blip does not page anyone, and who receives it. Our guide to downtime alerting setup covers thresholds, routing and testing, and the downtime alerts checklist helps you confirm that notifications actually arrive in minutes.
You can start with the Pingfloat Website Uptime Monitor, which needs no installation. Scheduled monitoring is part of the optional sign-up features.
When a check fails, the status code tells you where to look first. Our reference pages on a 500 Internal Server Error and a 503 Service Unavailable response are good links to drop into a runbook.

SSL certificate checks
An expired certificate is one of the most avoidable outages. Add a certificate check to the release checklist and to the monthly review: confirm the expiry date, the chain and the hostnames covered. Running the SSL Checker after any change to a load balancer, CDN or domain takes seconds. For a broader pass, the web security checklist turns this into something a team will actually use.
Network and DNS troubleshooting
When the app is fine but users cannot reach it, the fault is often in the path: DNS, routing or a hop along the way. A traceroute shows where packets slow down or stop, and a handful of DNS commands narrow the cause quickly. Our walkthrough of DNS troubleshooting for IT and dev teams lists five commands to find faults. Put both in the runbook under "users report the site is unreachable."
Teams that grow beyond basic checks often discuss the difference between monitoring and observability. A write-up on network observability versus monitoring explains how the two relate when you are troubleshooting. On the pipeline side, AWS notes that effective observability aggregates logs, metrics and traces from every stage to diagnose issues quickly, which goes well beyond a simple up or down signal.
JSON and data validation
Malformed JSON in a config file, webhook payload or API response breaks things in confusing ways. A formatter and validator in the review routine catches a missing comma before it reaches staging. For API-heavy work, automate the same checks through the Pingfloat Public API so they run inside scripts and pipelines instead of a browser tab.
An incident management workflow that holds up under pressure
An incident workflow answers one question: when something breaks, what happens in the first ten minutes? The GitLab Handbook describes a lifecycle of preparation, identification, investigation, containment, remediation, recovery and learnings. You can adopt that shape directly.
- Preparation. Write runbooks, set alert routing and agree on severity levels before anything fails.
- Identification. An alert, a customer report or a failed uptime check opens an incident. Someone acknowledges it so the team knows it has an owner.
- Investigation. Check the usual suspects in order: recent deploys, certificate status, DNS, the network path, then application logs.
- Containment. Stop the damage. That might mean rolling back a release or disabling a feature flag.
- Remediation and recovery. Fix the cause, restore service, and confirm it with the same checks that detected the problem.
- Learnings. Review what happened and decide what changes.
Roles keep the room calm
The GitLab handbook names clear roles: an Incident Lead who coordinates, an Incident Responder who investigates technically, and a Communications Lead who keeps stakeholders informed. Even a team of four can assign these for the duration of an incident. Separating coordination from investigation stops the person debugging from also answering every message.
Review without blame
Post-incident work such as root cause analysis and lessons-learned meetings is essential for improving resilience and preventing repeat occurrences, according to the State of Mississippi's enterprise incident response plan. Keep the meeting blameless, produce a short list of actions with owners, and add any missing check to the pipeline or the monitoring setup.
Perspective: monitor the basics first
We build tools for developers and IT teams, and we see the same pattern again and again. Teams invest heavily in planning boards and pipelines, then learn about an outage from a customer. The cheapest fix is also the least glamorous: put a few small, always-available checks around production.
That is why we keep core tools free and open without an account. An uptime check, a certificate check, a traceroute and a JSON validator should take seconds, not a procurement cycle. When a tool is that easy to reach, people use it during the incident and during review, which is when it matters.
Our view is that a workflow is only as good as the habits that fit inside it. A runbook that links to the exact tool for each step beats a perfect diagram nobody opens. Start with the checks, wire them into your definition of done, and sign up for scheduling and team features once the habit sticks.
Andreas
Put these checks to work
Pingfloat is a free suite of web tools for developers and IT professionals. It includes an uptime monitor, SSL checker, traceroute, file sharing, QR codes, JSON formatting, regex testing, header inspection and more. Core tools work with no installation or account, so you can add them to a runbook today.
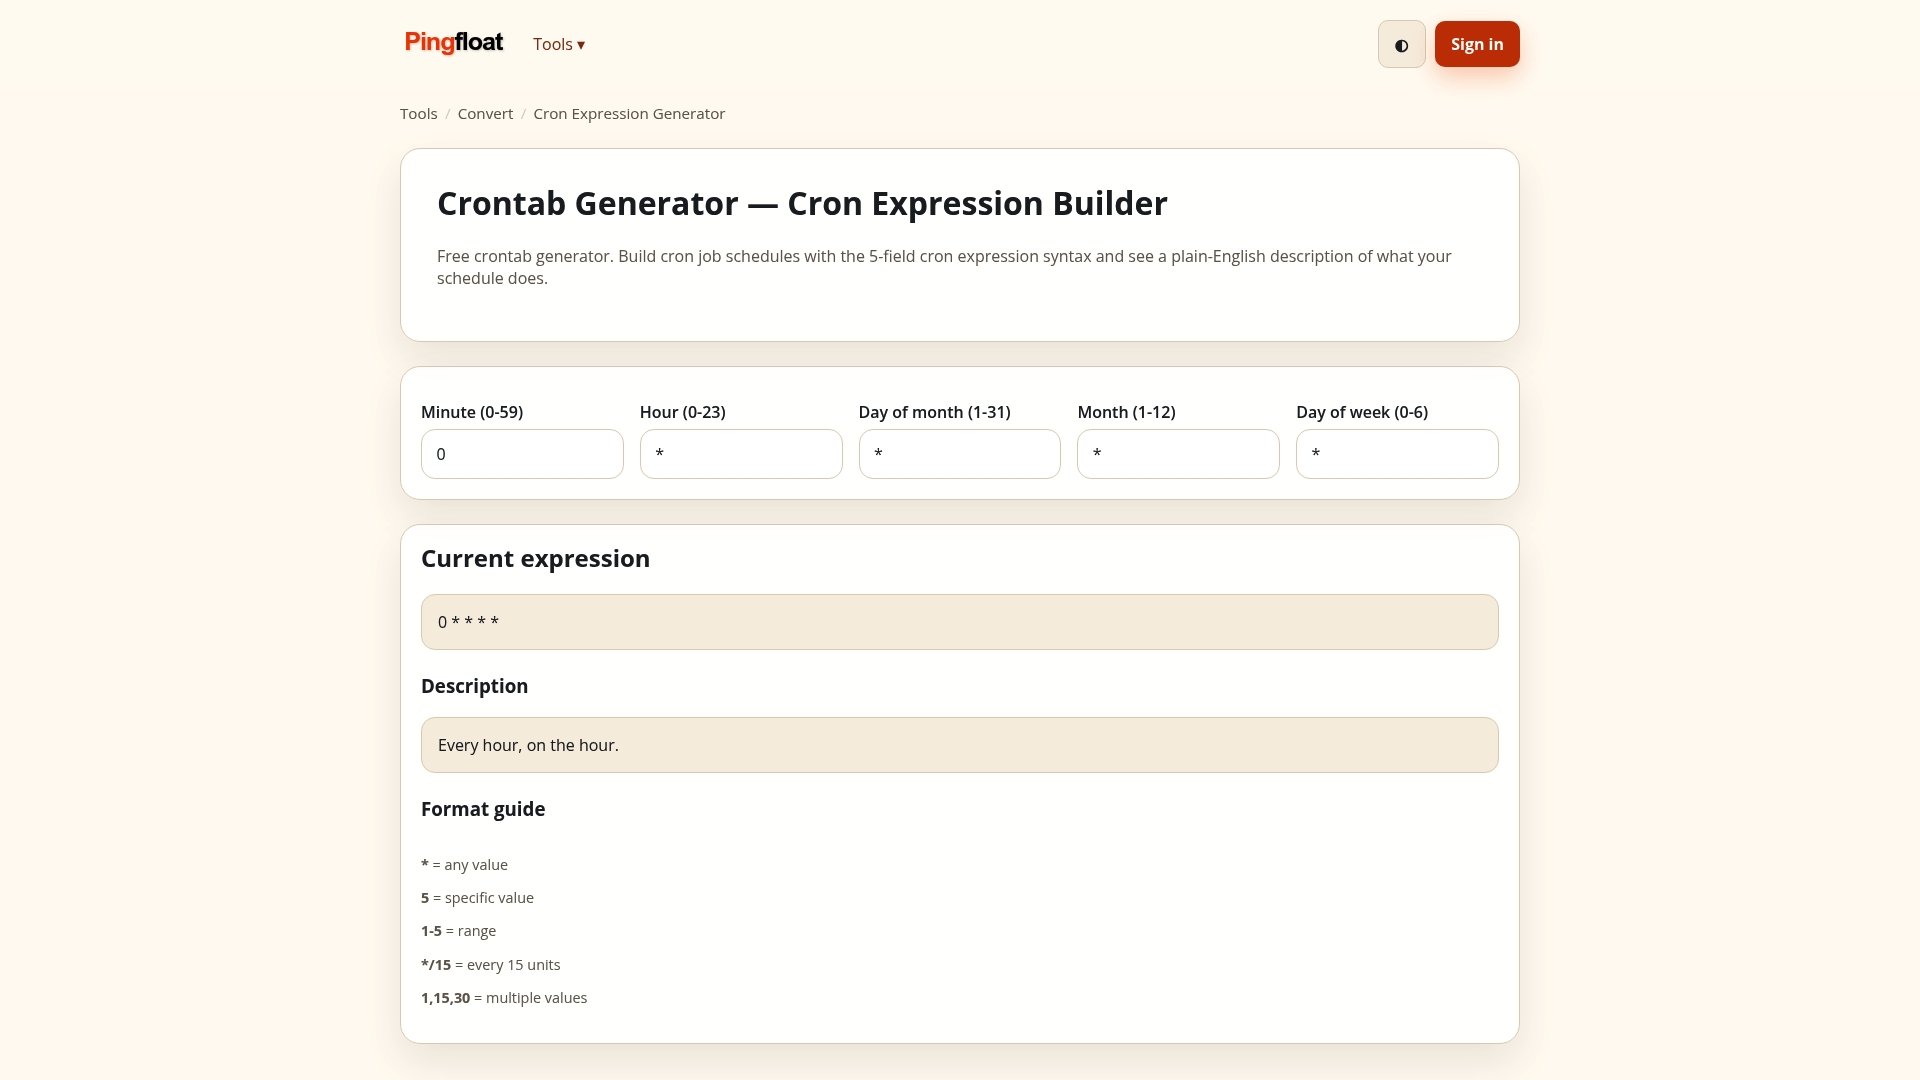
Start with the uptime monitor and SSL checker, or browse the full set of tools and pick the ones your incident runbook needs.
Assigning ownership and improving over time
A workflow written once and never touched goes stale. AWS's DevOps guidance describes how teams improve by explicitly assigning owners to process stages, defining clear done criteria, and running blameless retrospectives after development cycles and incidents. They also use automated metrics and regular reviews to spot bottlenecks and update runbooks.
A simple way to start:
- Name an owner per stage. One person is accountable for planning quality, one for the pipeline, one for production health. Owners can rotate, but the seat is never empty.
- Keep runbooks next to the alerts. Every alert should link to a page that says what it means and what to try first.
- Track a few pipeline metrics. Lead time, failed deployments and time to restore service are enough to reveal where work stalls.
- Review on a schedule. After each release cycle or incident, change one thing and write it down.
- Test your alerts. Trigger a harmless failure now and then and confirm the right person is notified.
Small, regular changes beat a big process overhaul. A team that fixes one gap after each incident ends up with a workflow shaped by its real failures.
FAQ
What is the difference between a development workflow and the SDLC?
The SDLC is the formal framework that describes the phases of building software from start to finish. A workflow is how your own team applies it day to day: the boards, branches, reviews, pipelines and handoffs you actually use. Two teams can follow the same lifecycle with very different workflows.
Which collaboration tools does a small dev team need?
Start with an issue tracker, a Git host with pull requests, team chat, a place for documentation and a CI pipeline. Add production monitoring and a secure way to share files. Choosing one tool per job and agreeing on it matters more than the number of tools.
How do we build uptime and SSL checks into our process?
Add them to your definition of done: any new endpoint or domain needs a monitoring check and a certificate check before the ticket closes. Route alerts to a named person or channel and test them. Free tools let you begin without a budget conversation.
What should an incident management workflow include?
At minimum: a detection signal, an acknowledgment step, defined roles, an investigation order, a containment option such as rollback, and a blameless review with owned actions. The lifecycle used by large engineering teams covers preparation through learnings, and smaller teams can use the same steps in lighter form.
How often should we review our workflow?
Review after every release cycle and every significant incident. Keep the meeting short, change one thing, and record the result in your runbook so the improvement sticks.
Sources
- What is the Software Development Lifecycle (SDLC)? | IBM
- The 7 stages of the SDLC explained | TechTarget
- What is the SDLC? | GitHub
- Architecture Strategies for Formalizing Development Practices | Microsoft Learn
- Accelerate Value Delivery | Disciplined Agile, PMI
- DevOps Guidance | AWS Well-Architected
- Implement fully-automated deployments | HashiCorp Well-Architected Framework
- Incident Management | The GitLab Handbook
- Enterprise Security Incident Response Plan | State of Mississippi ITS
- CI/CD interview questions
- Network Observability vs Monitoring